The Complexity of European Geography
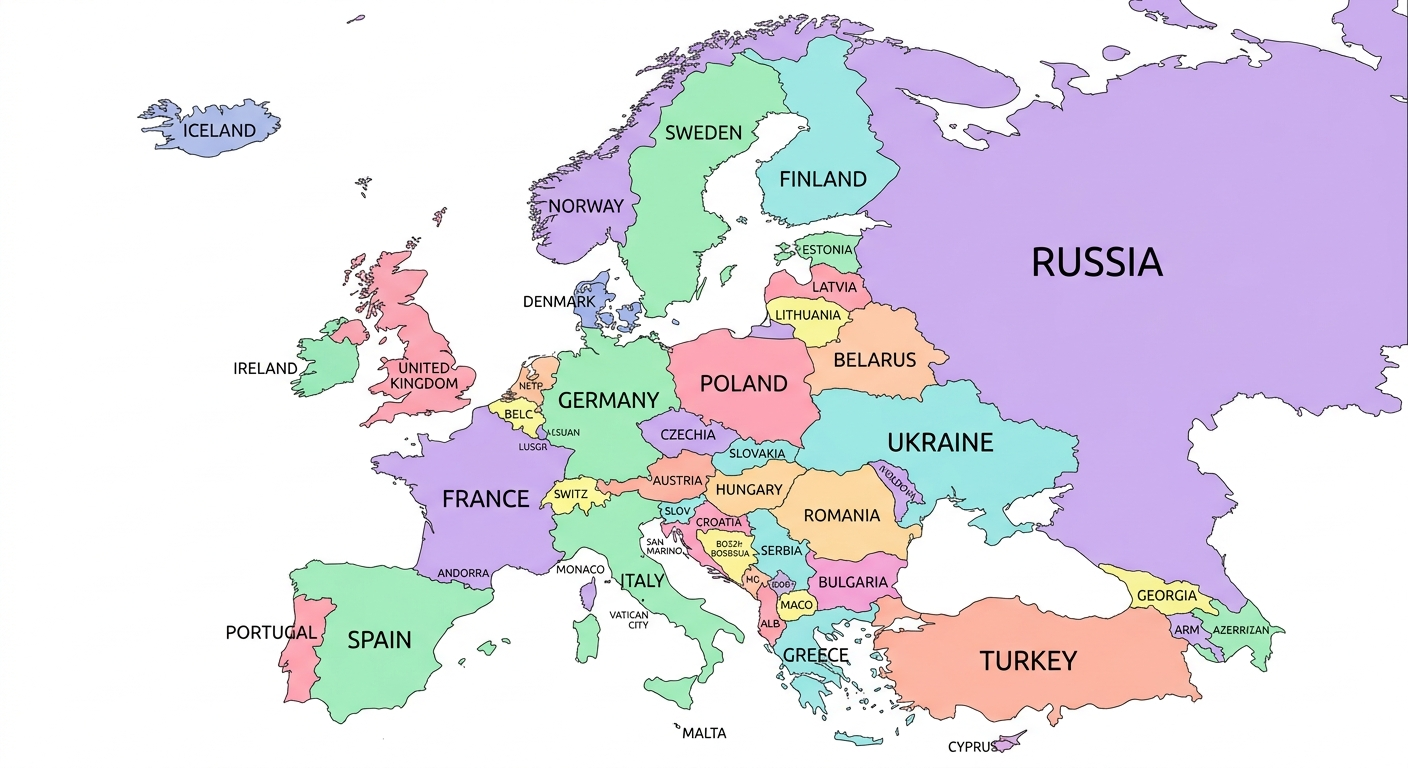
Despite being the second-smallest continent, Europe contains approximately 44 sovereign nations. These range from the expansive territory of France to microstates like Vatican City and San Marino. Understanding how these pieces fit together—politically, economically, and geographically—is the primary reason users turn to an interactive Europe map. Static maps often fail to capture the nuances of European integration, such as which countries belong to the Eurozone versus the wider European Union.
Understanding the European Union and Schengen Area
One of the most frequent use cases for our tool is distinguishing between various European organizations. For instance, the European Union (EU) is a political and economic union of 27 states, whereas the Schengen Area refers to 29 European countries that have officially abolished passport and all other types of border control at their mutual borders. With WorldMap Pro, you can create separate layers to visualize these overlapping jurisdictions clearly.
Pro Tip: Use the "Color Fill" tool to highlight EU member states in blue and non-EU members in grey to visualize regional economic influence instantly. Since all processing is local, your custom data remains private.
Educational Applications for Interactive Europe Maps
In the classroom, a blank Europe map is a foundational teaching tool. Geography isn't just about names; it's about spatial reasoning. By manually coloring the Iberian Peninsula or the Balkan States, students build a mental model of the world that static textbooks cannot provide. This hands-on approach has been proven to increase retention and geographical literacy.
1. Teaching the "Big Five" Economies
Students can identify and color-code the five largest economies in Europe: Germany, the United Kingdom, France, Italy, and Spain. This visual hierarchy helps students associate geographic size with economic data, creating a more holistic understanding of global power dynamics.
2. Historical Border Shifts
History teachers can use our interactive tool to demonstrate the expansion of the Roman Empire or the changing borders following World War II. By placing pins on key historical sites like Berlin or Paris, the map becomes a living timeline that helps students connect events with locations.
Business and Logistics Visualization
For modern businesses, Europe represents a single market with complex logistics. Supply chain managers use WorldMap Pro to mark regional distribution hubs and shipping lanes through the North Sea and the Mediterranean. In an era of data security concerns, knowing that your proprietary shipping routes stay in your browser is a significant advantage.
- Distribution Hubs: Mark ports like Rotterdam and Hamburg with custom pins to visualize trade flow and logistics bottlenecks.
- Sales Territories: Companies can color-code their market share across different European regions to identify growth opportunities.
- Regional Compliance: Use the map to track different regulatory zones across Eastern and Western Europe.
Technical Guide: Customizing Your European View
Creating a high-quality map shouldn't require complex software. Our tool is designed for speed and professional output:
Select the Europe Layout
Open the map editor and choose the Europe view. This automatically centers the camera on the continent and provides a clear view of all 44+ nations.
Customize Country Colors
Click on any nation to change its color. This is ideal for highlighting regions like the Baltics, Scandinavia, or the Mediterranean coast.
Export and Share
Once your design is ready, download it as a high-resolution PNG or PDF. Perfect for school projects or boardroom presentations.
Ready to Map Europe?
Start customizing your interactive Europe map today with 100% privacy. No account required.
Open Map Tool →